WiFi Guest Access > WiFi analytics dashboard
WiFi analytics dashboard
Our Analytics Dashboard allows you to gather and analyze WiFi data and get insights about your customers.

User-friendly interface
Your customers want to see concrete results: a significant number or new registrations and returning users, happy and engaged customers.
The Classic Hotspot Dashboard is the analytics tool that displays the data captured through Wi-Fi. The dashboard was designed by Tanaza to enable companies to analyze data and provide insights with a nice graphic interface.
If you would like to share the data collected, you can do so without giving users permission to change your Wi-Fi configurations.

Real-time data reports
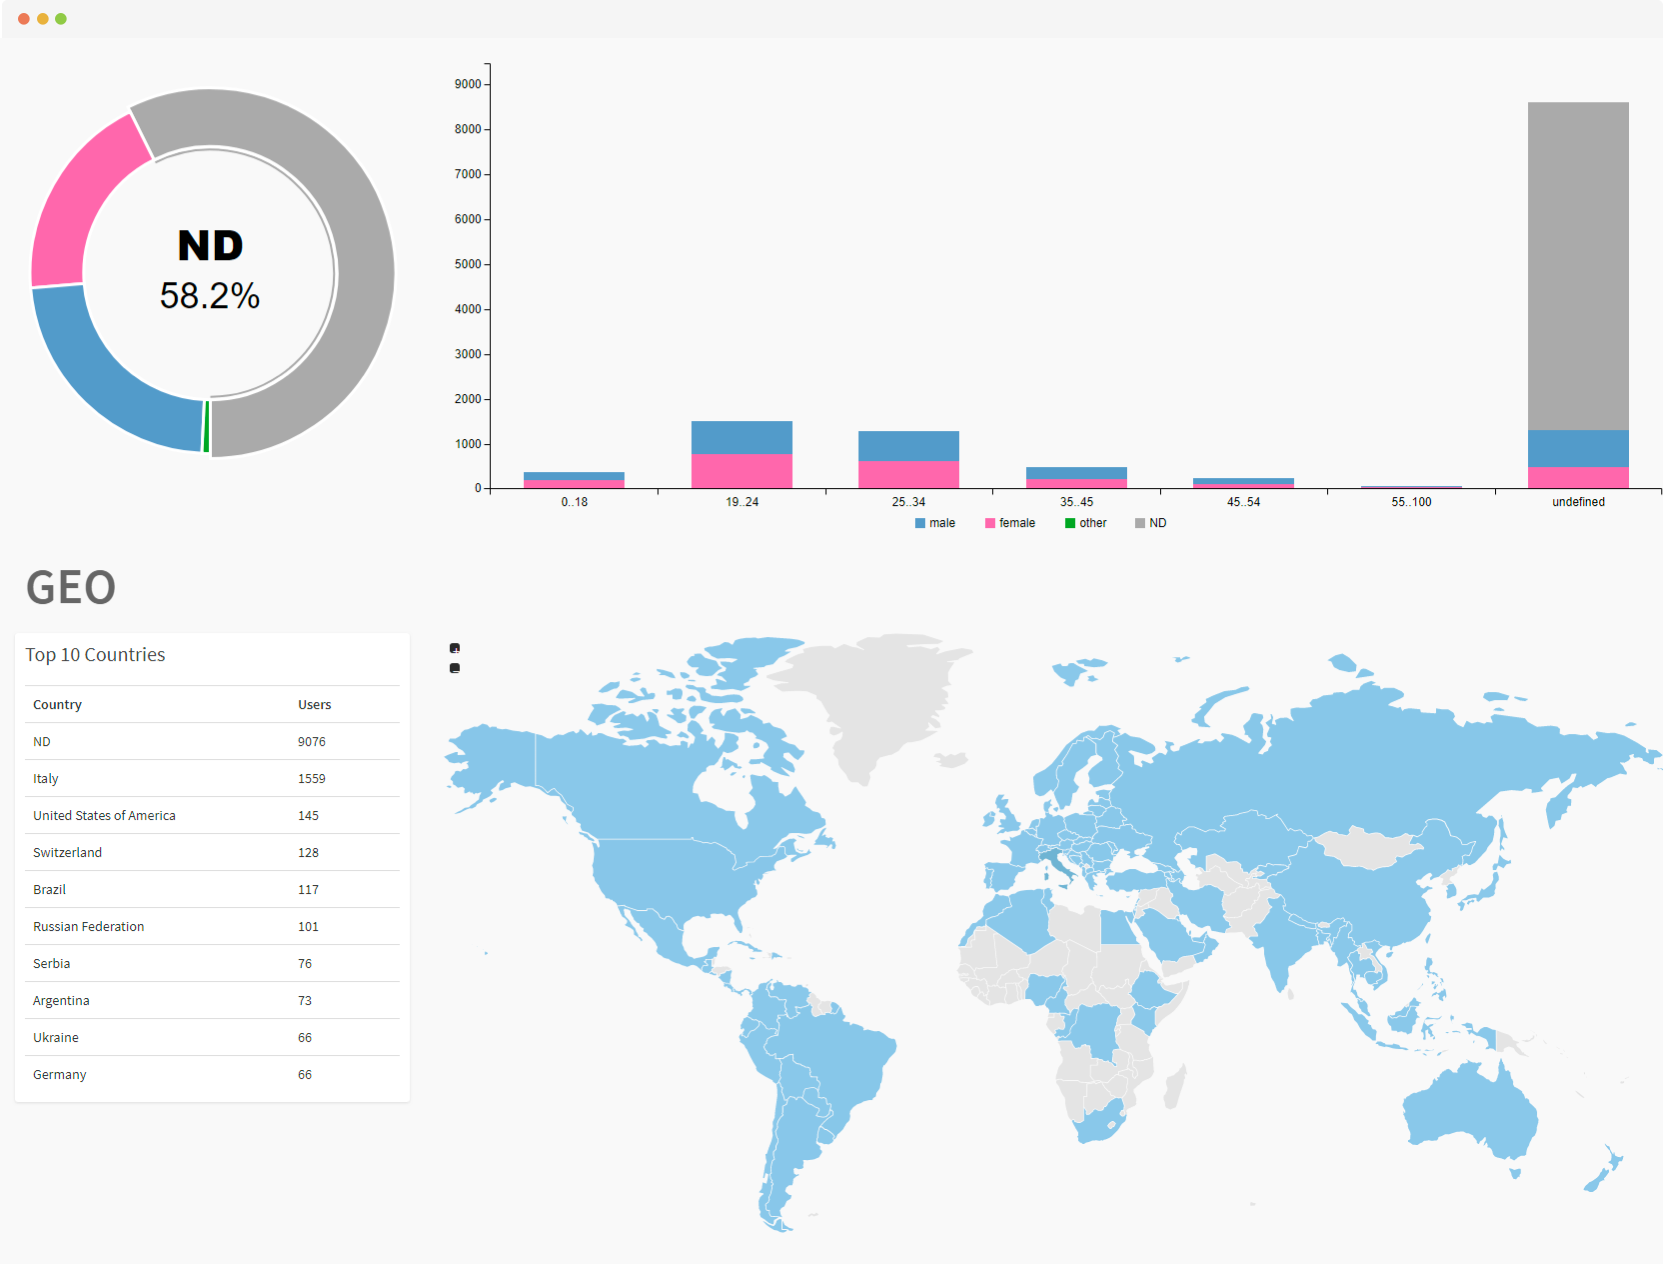
The dashboard shows the number of returning versus new users and aggregated data about their gender, age, geographic origin, preferred login method. It also highlights who are your most engaged users and how many Facebook Likes/Check-in a location has received from WiFi users. In addition to that, the dashboard serves as a database for all clients and their connections, showing detailed information per client and allowing export to CSV or XLSX.
Per-user data
- Name and surname
- Age and birth date
- E-mail address
- Phone number (verified with SMS token)
- Social network chosen to log in
- Number of WiFi connections
- Date the user registered on
- AP name and SSID used to connect
- MAC address of the AP
- IP Address and MAC address of the client
Summarized data
- Top 5 users
- New registrations (unique users)
- Returning users
- Trends of the week/the month/the year
- Number of users that used a specific social network to login: trend, single day stats
- Facebook check-ins
- Gender and age
- Location: world map or single country stats
Advanced filters
Filters include:
- Age or age range
- Gender
- Location (city and country)
- Login flow
- Date of registration
- SSID
Data segmentation and filters
The dashboard’s user-friendly interface makes Wi-Fi analytics very easy. It includes general statistics and trends, top users, authentication methods, geographic location of users, gender and age.
On this dashboard, the user selects a time period (day/week/month/custom date range), then he sees both detailed and summarized data of his Wi-Fi hotspot. Data can be exported via CSV (included in the Dashboard) or through APIs.
The dashboard can also be used to monitor and manage the consumption of paid WiFi environments.
Up next
Start the 15-days, no-limits, all-in-one free trial
